Ranked: U.S. Industries Where Companies Make the Most Profit
Ranked: The Top 10 Global Risks That Will Define the Future
Charted: Average Workers per U.S. Startup (1994-2023)
Charted: Approval Ratings of 24 World Leaders in 2025
Prediction Consensus: What the Experts See Coming in 2025
Visualizing Asia’s $40 Trillion Economy
Charted: The GDP Impact of Trump’s Tariffs on China
What Americans Think About Tariffs on Canada
Charted: U.S. National Debt, as a Percent of GDP (1900-2035P)
Visualizing China’s Dependence on U.S. Trade
Ranked: Google’s Thirstiest Data Centers
Charted: Average Workers per U.S. Startup (1994-2023)
Ranked: Semiconductor Production by Country or Region (1990-2032F)
Nvidia Loses Record-Setting $560B of Market Cap, Thanks to DeepSeek
Ranked: Semiconductor Foundries by Revenue Share
Visualized: The 1%’s Share of U.S. Wealth Over Time (1989-2024)
Charted: U.S. National Debt, as a Percent of GDP (1900-2035P)
Charted: U.S. Wealth Held by the Bottom 50% (1989-2024)
Visualizing the Growth of U.S. Consumer Debt
Charted: A Handy List of Countries With No Income Taxes
Charted: Cigarette Smoking’s Decline in U.S. Young Adults
Visualizing Drug Use Trends in U.S. Young Adults
Charted: The Surge of Vaping in America’s Young Adults
Visualized: Who Funds the World Health Organization?
Mapped: Emergency Room Visit Times by State
How Many New Mines Are Needed for the Energy Transition?
Where the U.S. Gets Its Enriched Uranium
Oil & Gas Leases on Public Lands Under Obama, Trump, and Biden
Which State Has the Highest Gas Price in 2024?
Charted: Copper vs. Oil Demand (1970-2040)
Mapped: How Much Each U.S. State Spends on Education
Ranked: Google’s Thirstiest Data Centers
Mapped: Days of Work to Afford a Monthly Mortgage, by State
Mapped: Where Fortune 500 Companies Are Relocating in the U.S.
Mapped: The Top Import Partner of Every U.S. State
Ranked: How Key Commodities Have Performed Since 2019
How Many New Mines Are Needed for the Energy Transition?
Visualizing Europe’s Dependence on Chinese Resources
Charted: 20 Years of U.S. and Chinese FDI in Africa
Visualizing the Supply Deficit of Battery Minerals (2024-2034P)
Ranked: Google’s Thirstiest Data Centers
Visualizing California’s Drought Conditions (2000–2025)
How Much of the World’s Plastic Waste Actually Gets Recycled?
Mapped: Water Violations by State
Charted: Per-Capita CO2 Emissions by Global Region (1960-2022)
Published
on
By
Click to view this graphic in a higher-resolution.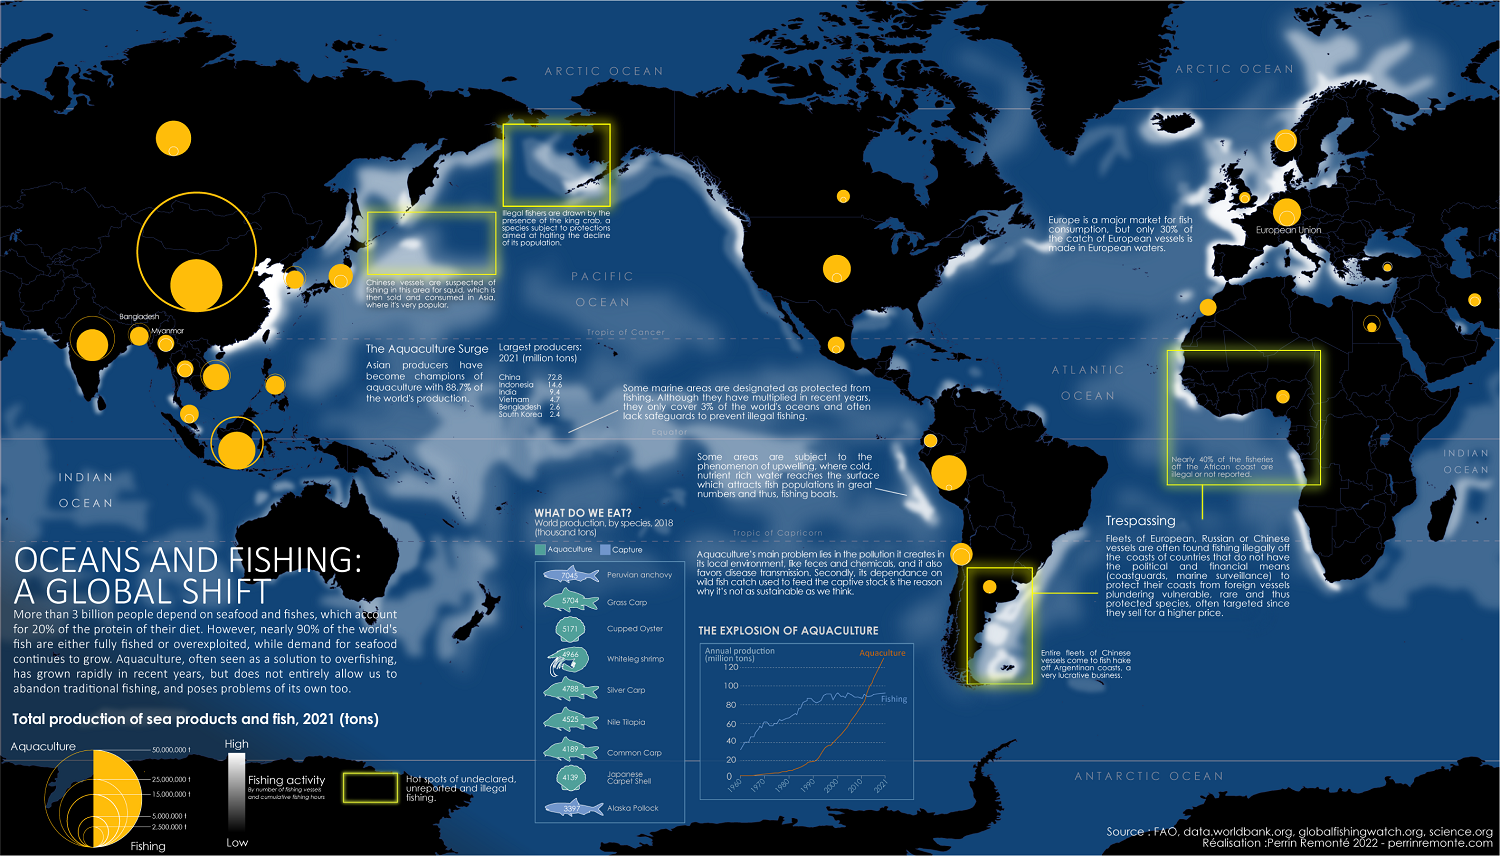
Fish and seafood is the most popularly consumed meat in the world, the first choice in more than 56 countries.
But where do our fish come from? Are they caught by massive ocean fishing boats, or farmed in sprawling aquaculture installations?
This map from creator Perrin Remonté points out where fishing activity (marked in white) occurs, using data from automatic identification system equipment aboard more than 70,000 industrial fishing vessels between 2012–2016.
The brightest white hotspots on the map—off the coast of China, western and nordic Europe, and the Pacific Northwest—give an indication of where most of the world’s fish supply is caught.
But who are the biggest producers?
By far the country with the biggest fish production is China, which supplied nearly 86 million metric tons of fish to the world in 2021, about 40% of global supply.
Chinese fishing vessels can be found fishing as far away from home as Argentina—sometimes illegally—to keep up with demand.
Here’s a list of the biggest fish producers, ranked by total output in 2021.
| Rank | Territory | Fish Production (2021, tonnes) |
|---|---|---|
| 1 | 🇨🇳 China | 85,948,134 |
| 2 | 🇮🇩 Indonesia | 21,813,413 |
| 3 | 🇮🇳 India | 14,433,205 |
| 4 | 🇻🇳 Vietnam | 8,289,524 |
| 5 | 🇵🇪 Peru | 6,726,989 |
| 6 | 🇷🇺 Russia | 5,487,045 |
| 7 | 🇺🇸 U.S. | 4,731,048 |
| 8 | 🇧🇩 Bangladesh | 4,621,228 |
| 9 | 🇳🇴 Norway | 4,220,624 |
| 10 | 🇵🇭 Philippines | 4,114,594 |
| 11 | 🇯🇵 Japan | 4,114,570 |
| 12 | 🇨🇱 Chile | 3,833,592 |
| 13 | 🇰🇷 South Korea | 3,742,566 |
| 14 | 🇲🇲 Myanmar | 2,594,957 |
| 15 | 🇹🇭 Thailand | 2,402,021 |
| 16 | 🇪🇬 Egypt | 2,001,959 |
| 17 | 🇲🇽 Mexico | 1,875,566 |
| 18 | 🇪🇨 Ecuador | 1,760,054 |
| 19 | 🇲🇾 Malaysia | 1,754,209 |
| 20 | 🇲🇦 Morocco | 1,434,205 |
| 21 | 🇧🇷 Brazil | 1,410,979 |
| 22 | 🇮🇷 Iran | 1,258,203 |
| 23 | 🇮🇸 Iceland | 1,109,563 |
| 24 | 🇪🇸 Spain | 1,088,454 |
| 25 | 🇳🇬 Nigeria | 1,080,855 |
| 26 | 🇨🇦 Canada | 945,954 |
| 27 | 🇴🇲 Oman | 923,786 |
| 28 | 🇰🇵 North Korea | 888,630 |
| 29 | 🇬🇧 UK | 864,698 |
| 30 | 🇲🇷 Mauritania | 860,217 |
| 31 | 🇰🇭 Cambodia | 856,400 |
| 32 | 🇦🇷 Argentina | 856,253 |
| 33 | 🇹🇷 Türkiye | 799,844 |
| 34 | 🇺🇬 Uganda | 760,545 |
| 35 | 🇫🇷 France | 708,995 |
| 36 | 🇵🇰 Pakistan | 660,586 |
| 37 | 🇫🇴 Faroe Islands | 656,364 |
| 38 | 🇹🇿 Tanzania | 621,058 |
| 39 | 🇦🇴 Angola | 531,772 |
| 40 | 🇸🇳 Senegal | 515,108 |
| 41 | 🇩🇰 Denmark | 507,097 |
| 42 | 🇿🇦 South Africa | 501,855 |
| 43 | 🇬🇭 Ghana | 482,142 |
| 44 | 🇳🇿 New Zealand | 459,937 |
| 45 | 🇱🇰 Sri Lanka | 431,255 |
| 46 | 🇳🇦 Namibia | 411,170 |
| 47 | 🇲🇿 Mozambique | 376,763 |
| 48 | 🇳🇱 Netherlands | 340,131 |
| 49 | 🇬🇳 Guinea | 326,270 |
| 50 | 🇨🇴 Colombia | 321,390 |
| 51 | 🇨🇲 Cameroon | 300,130 |
| 52 | 🇦🇺 Australia | 297,233 |
| 53 | 🇮🇹 Italy | 296,358 |
| 54 | 🇻🇪 Venezuela | 276,701 |
| 55 | 🇮🇪 Ireland | 276,258 |
| 56 | 🇬🇱 Greenland | 271,027 |
| 57 | 🇵🇱 Poland | 246,172 |
| 58 | 🇨🇩 DRC | 233,860 |
| 59 | 🇬🇪 Georgia | 220,365 |
| 60 | 🇩🇪 Germany | 220,312 |
| 61 | 🇱🇦 Laos | 206,008 |
| 62 | 🇸🇱 Sierra Leone | 205,015 |
| 63 | 🇬🇷 Greece | 203,558 |
| 64 | 🇵🇹 Portugal | 199,046 |
| 65 | 🇵🇬 Papua New Guinea |
194,786 |
| 66 | 🇧🇿 Belize | 192,226 |
| 67 | 🇰🇮 Kiribati | 191,168 |
| 68 | 🇵🇦 Panama | 183,774 |
| 69 | 🇸🇦 Saudi Arabia | 181,949 |
| 70 | 🇲🇼 Malawi | 180,508 |
| 71 | 🇸🇪 Sweden | 175,222 |
| 72 | 🇺🇿 Uzbekistan | 171,933 |
| 73 | 🇿🇲 Zambia | 168,480 |
| 74 | 🇫🇲 Micronesia | 166,334 |
| 75 | 🇰🇪 Kenya | 152,728 |
| 76 | 🇹🇳 Tunisia | 150,321 |
| 77 | 🇲🇻 Maldives | 144,993 |
| 78 | 🇫🇮 Finland | 139,370 |
| 79 | 🇸🇨 Seychelles | 139,174 |
| 80 | 🇾🇪 Yemen | 131,317 |
| 81 | 🇲🇬 Madagascar | 130,333 |
| 82 | 🇳🇵 Nepal | 121,854 |
| 83 | 🇳🇷 Nauru | 120,410 |
| 84 | 🇭🇰 Hong Kong | 119,088 |
| 85 | 🇲🇱 Mali | 115,584 |
| 86 | 🇨🇮 Cote d’Ivoire | 111,015 |
| 87 | 🇹🇩 Chad | 103,110 |
| 88 | 🇱🇹 Lithuania | 101,290 |
| 89 | 🇲🇭 Marshall Islands | 95,933 |
| 90 | 🇭🇷 Croatia | 89,253 |
| 91 | 🇳🇮 Nicaragua | 86,280 |
| 92 | 🇩🇿 Algeria | 83,979 |
| 93 | 🇭🇳 Honduras | 79,518 |
| 94 | 🇺🇦 Ukraine | 79,388 |
| 95 | 🇧🇯 Benin | 78,765 |
| 96 | 🇪🇪 Estonia | 73,085 |
| 97 | 🇸🇻 El Salvador | 71,754 |
| 98 | 🇨🇬 Congo | 70,330 |
| 99 | 🇺🇾 Uruguay | 66,403 |
| 100 | 🇮🇶 Iraq | 66,374 |
| 101 | 🇦🇪 UAE | 63,852 |
| 102 | 🇬🇼 Guinea-Bissau | 63,231 |
| 103 | 🇱🇻 Latvia | 62,560 |
| 104 | 🇸🇧 Solomon Islands |
62,314 |
| 105 | 🇪🇹 Ethiopia | 61,390 |
| 106 | 🇻🇺 Vanuatu | 55,935 |
| 107 | 🇬🇲 Gambia | 52,687 |
| 108 | 🇳🇪 Niger | 47,672 |
| 109 | 🇰🇿 Kazakhstan | 46,896 |
| 110 | 🇨🇷 Costa Rica | 46,432 |
| 111 | 🇸🇩 Sudan | 44,450 |
| 112 | 🇬🇹 Guatemala | 43,666 |
| 113 | 🇷🇼 Rwanda | 42,407 |
| 114 | 🇨🇺 Cuba | 40,718 |
| 115 | 🇬🇾 Guyana | 34,358 |
| 116 | 🇫🇯 Fiji | 33,081 |
| 117 | 🇲🇺 Mauritius | 32,955 |
| 118 | 🇸🇸 South Sudan | 32,545 |
| 119 | 🇸🇷 Suriname | 32,170 |
| 120 | 🇱🇾 Libya | 31,961 |
| 121 | 🇵🇾 Paraguay | 31,710 |
| 122 | 🇹🇻 Tuvalu | 31,097 |
| 123 | 🇧🇫 Burkina Faso | 30,609 |
| 124 | 🇸🇴 Somalia | 30,000 |
| 125 | 🇬🇦 Gabon | 29,925 |
| 126 | 🇨🇫 Central African Republic |
28,215 |
| 127 | 🇿🇼 Zimbabwe | 27,792 |
| 128 | 🇱🇷 Liberia | 25,444 |
| 129 | 🇨🇼 Curacao | 25,027 |
| 130 | 🇨🇿 Czechia | 24,305 |
| 131 | 🇧🇬 Bulgaria | 24,183 |
| 132 | 🇭🇺 Hungary | 22,447 |
| 133 | 🇧🇮 Burundi | 21,040 |
| 134 | 🇩🇴 Dominican Republic |
20,397 |
| 135 | 🇧🇳 Brunei Darussalam |
20,063 |
| 136 | 🇦🇲 Armenia | 19,700 |
| 137 | 🇰🇲 Comoros | 19,356 |
| 138 | 🇲🇹 Malta | 18,936 |
| 139 | 🇹🇬 Togo | 18,866 |
| 140 | 🇦🇱 Albania | 18,283 |
| 141 | 🇧🇪 Belgium | 18,160 |
| 142 | 🇷🇴 Romania | 18,065 |
| 143 | 🇭🇹 Haiti | 17,830 |
| 144 | 🇮🇱 Israel | 16,910 |
| 145 | 🇶🇦 Qatar | 16,668 |
| 146 | 🇧🇭 Bahrain | 15,736 |
| 147 | 🇹🇲 Turkmenistan | 15,202 |
| 148 | 🇵🇫 French Polynesia | 14,802 |
| 149 | 🇹🇹 Trinidad & Tobago | 13,102 |
| 150 | 🇲🇩 Moldova | 12,905 |
| 151 | 🇦🇫 Afghanistan | 12,607 |
| 152 | 🇯🇲 Jamaica | 11,840 |
| 153 | 🇨🇻 Cabo Verde | 11,652 |
| 154 | 🇧🇴 Bolivia | 11,453 |
| 155 | 🇰🇬 Kyrgyz Republic | 10,320 |
| 156 | 🇷🇸 Serbia | 9,662 |
| 157 | 🇨🇾 Cyprus | 9,264 |
| 158 | 🇼🇸 Samoa | 9,186 |
| 159 | 🇧🇾 Belarus | 9,115 |
| 160 | 🇧🇸 Bahamas | 8,705 |
| 161 | 🇸🇾 Syria | 6,660 |
| 162 | 🇬🇶 Equatorial Guinea | 6,322 |
| 163 | 🇹🇱 Timor-Leste | 6,024 |
| 164 | 🇸🇹 Sao Tome & Principe |
6,020 |
| 165 | 🇸🇬 Singapore | 5,550 |
| 166 | 🇵🇸 West Bank & Gaza |
5,348 |
| 167 | 🇦🇹 Austria | 5,270 |
| 168 | 🇳🇨 New Caledonia | 4,715 |
| 169 | 🇪🇷 Eritrea | 4,578 |
| 170 | 🇹🇯 Tajikistan | 4,389 |
| 171 | 🇧🇦 Bosnia & Herzegovina |
4,124 |
| 172 | 🇸🇰 Slovak Republic | 4,119 |
| 173 | 🇰🇼 Kuwait | 3,975 |
| 174 | 🇨🇭 Switzerland | 3,850 |
| 175 | 🇲🇰 North Macedonia | 3,683 |
| 176 | 🇱🇧 Lebanon | 3,358 |
| 177 | 🇯🇪 Channel Islands | 3,333 |
| 178 | 🇦🇬 Antigua & Barbuda |
3,225 |
| 179 | 🇩🇯 Djibouti | 3,089 |
| 180 | 🇮🇲 Isle of Man | 3,041 |
| 181 | 🇯🇴 Jordan | 2,810 |
| 182 | 🇹🇨 Turks & Caicos Islands |
2,277 |
| 183 | 🇦🇿 Azerbaijan | 1,971 |
| 184 | 🇸🇮 Slovenia | 1,955 |
| 185 | 🇲🇪 Montenegro | 1,666 |
| 186 | 🇱🇨 St. Lucia | 1,625 |
| 187 | 🇻🇨 St. Vincent & the Grenadines |
1,599 |
| 188 | 🇵🇷 Puerto Rico | 1,598 |
| 189 | 🇱🇸 Lesotho | 1,556 |
| 190 | 🇲🇴 Macao | 1,500 |
| 191 | 🇹🇴 Tonga | 1,265 |
| 192 | 🇻🇬 British Virgin Islands | 1,134 |
| 193 | 🇦🇸 American Samoa | 1,079 |
| 194 | 🇬🇩 Grenada | 1,046 |
| 195 | 🇧🇧 Barbados | 872 |
| 196 | 🇵🇼 Palau | 804 |
| 197 | 🇻🇮 Virgin Islands | 428 |
| 198 | 🇧🇲 Bermuda | 419 |
| 199 | 🇰🇳 St. Kitts & Nevis |
371 |
| 200 | 🇩🇲 Dominica | 289 |
| 201 | 🇸🇽 Sint Maarten | 253 |
| 202 | 🇲🇵 Northern Mariana Islands |
230 |
| 203 | 🇧🇹 Bhutan | 208 |
| 204 | 🇧🇼 Botswana | 201 |
| 205 | 🇦🇼 Aruba | 167 |
| 206 | 🇸🇿 Eswatini | 165 |
| 207 | 🇬🇺 Guam | 141 |
| 208 | 🇰🇾 Cayman Islands | 135 |
| 209 | 🇫🇷 St. Martin | 90 |
| 210 | 🇬🇮 Gibraltar | 1 |
| 211 | 🇲🇨 Monaco | 1 |
| N/A | 🌐 World | 216,872,258 |
Source: World Bank.
Other Asian countries—Indonesia (21.8 million tonnes), India (14.4 million tonnes), and Vietnam (8.2 million tonnes)—fill out the next few spots. Peru, with an annual production of 6.7 million tonnes rounds out the top five fish suppliers, which together account for nearly 60% of world fish supply.
The second half of the top 10 also has representatives from North America (the U.S.) and Europe (Russia), the latter whose fleets have also been caught fishing illegally off the coast of Africa.
A big footnote on total fish production is that it also includes aquaculture and farmed fish. Breaking down total fish supply between farmed and captured fish reveals some interesting trends. Here we rank the biggest fish suppliers by their farmed fish output.
| Rank | Territory | Aquaculture Supply (2021, tonnes) |
Captured Supply (2021, tonnes) |
|---|---|---|---|
| 1 | 🇨🇳 China | 72,805,297 | 13,142,837 |
| 2 | 🇮🇩 Indonesia | 14,606,534 | 7,206,879 |
| 3 | 🇮🇳 India | 9,408,300 | 5,024,905 |
| 4 | 🇻🇳 Vietnam | 4,749,274 | 3,540,250 |
| 5 | 🇧🇩 Bangladesh | 2,638,745 | 1,982,483 |
| 6 | 🇰🇷 South Korea | 2,427,677 | 1,314,889 |
| 7 | 🇵🇭 Philippines | 2,272,528 | 1,842,067 |
| 8 | 🇳🇴 Norway | 1,665,112 | 2,555,512 |
| 9 | 🇪🇬 Egypt | 1,576,189 | 425,770 |
| 10 | 🇨🇱 Chile | 1,443,520 | 2,390,072 |
| 11 | 🇹🇭 Thailand | 989,898 | 1,412,123 |
| 12 | 🇯🇵 Japan | 963,680 | 3,150,890 |
| 13 | 🇲🇲 Myanmar | 929,217 | 1,665,740 |
| 14 | 🇪🇨 Ecuador | 896,435 | 863,619 |
| 15 | 🇰🇵 North Korea | 680,560 | 208,070 |
| 16 | 🇧🇷 Brazil | 650,356 | 760,623 |
| 17 | 🇮🇷 Iran | 478,737 | 779,466 |
| 18 | 🇹🇷 Türkiye | 471,686 | 328,158 |
| 19 | 🇺🇸 U.S. | 448,615 | 4,282,433 |
| 20 | 🇲🇾 Malaysia | 416,978 | 1,337,231 |
| 21 | 🇰🇭 Cambodia | 348,350 | 508,050 |
| 22 | 🇷🇺 Russia | 319,342 | 5,167,703 |
| 23 | 🇪🇸 Spain | 279,910 | 808,544 |
| 24 | 🇳🇬 Nigeria | 275,645 | 805,210 |
| 25 | 🇲🇽 Mexico | 246,914 | 1,628,652 |
| 26 | 🇬🇧 UK | 230,280 | 634,419 |
| 27 | 🇫🇷 France | 198,886 | 510,110 |
| 28 | 🇨🇴 Colombia | 192,521 | 128,869 |
| 29 | 🇨🇦 Canada | 191,449 | 754,505 |
| 30 | 🇵🇰 Pakistan | 164,527 | 496,059 |
| 31 | 🇵🇪 Peru | 150,818 | 6,576,171 |
| 32 | 🇮🇹 Italy | 145,862 | 150,496 |
| 33 | 🇬🇷 Greece | 143,926 | 59,632 |
| 34 | 🇺🇬 Uganda | 138,558 | 621,987 |
| 35 | 🇱🇦 Laos | 135,008 | 71,000 |
| 36 | 🇦🇺 Australia | 126,206 | 171,026 |
| 37 | 🇺🇿 Uzbekistan | 118,933 | 53,000 |
| 38 | 🇳🇿 New Zealand | 116,839 | 343,098 |
| 39 | 🇫🇴 Faroe Islands | 115,760 | 540,604 |
| 40 | 🇸🇦 Saudi Arabia | 114,490 | 67,459 |
| 41 | 🇹🇿 Tanzania | 106,482 | 514,575 |
| 42 | 🇳🇵 Nepal | 100,854 | 21,000 |
| 43 | 🇬🇭 Ghana | 89,380 | 392,762 |
| 44 | 🇿🇲 Zambia | 63,355 | 105,125 |
| 45 | 🇭🇳 Honduras | 63,268 | 16,250 |
| 46 | 🇻🇪 Venezuela | 53,601 | 223,100 |
| 47 | 🇮🇸 Iceland | 53,136 | 1,056,427 |
| 48 | 🇱🇰 Sri Lanka | 50,977 | 380,278 |
| 49 | 🇵🇱 Poland | 44,787 | 201,385 |
| 50 | 🇮🇪 Ireland | 42,099 | 234,159 |
| 51 | 🇩🇰 Denmark | 40,594 | 466,503 |
| 52 | 🇳🇱 Netherlands | 40,590 | 299,541 |
| 53 | 🇩🇪 Germany | 32,649 | 187,663 |
| 54 | 🇬🇹 Guatemala | 32,583 | 11,082 |
| 55 | 🇳🇮 Nicaragua | 31,006 | 55,275 |
| 56 | 🇭🇷 Croatia | 26,831 | 62,422 |
| 57 | 🇹🇳 Tunisia | 26,077 | 124,243 |
| 58 | 🇮🇶 Iraq | 22,694 | 43,680 |
| 59 | 🇨🇺 Cuba | 22,665 | 18,053 |
| 60 | 🇰🇪 Kenya | 21,825 | 130,903 |
| 61 | 🇨🇿 Czechia | 20,991 | 3,314 |
| 62 | 🇵🇹 Portugal | 19,516 | 179,530 |
| 63 | 🇦🇲 Armenia | 18,930 | 770 |
| 64 | 🇭🇺 Hungary | 17,847 | 4,601 |
| 65 | 🇨🇷 Costa Rica | 17,309 | 29,123 |
| 66 | 🇺🇦 Ukraine | 16,882 | 62,506 |
| 67 | 🇲🇹 Malta | 16,433 | 2,503 |
| 68 | 🇲🇬 Madagascar | 16,396 | 113,937 |
| 69 | 🇸🇪 Sweden | 15,253 | 159,969 |
| 70 | 🇧🇬 Bulgaria | 15,174 | 9,009 |
| 71 | 🇮🇱 Israel | 14,875 | 2,035 |
| 72 | 🇫🇮 Finland | 14,399 | 124,971 |
| 73 | 🇵🇾 Paraguay | 14,150 | 17,560 |
| 74 | 🇲🇩 Moldova | 12,905 | 0 |
| 75 | 🇸🇻 El Salvador | 12,749 | 59,005 |
| 76 | 🇸🇧 Solomon Islands | 12,461 | 49,854 |
| 77 | 🇷🇴 Romania | 11,714 | 6,351 |
| 78 | 🇦🇫 Afghanistan | 11,107 | 1,500 |
| 79 | 🇿🇦 South Africa | 10,525 | 491,330 |
| 80 | 🇷🇼 Rwanda | 10,313 | 32,094 |
| 81 | 🇰🇬 Kyrgyz Republic | 10,300 | 20 |
| 82 | 🇲🇼 Malawi | 9,948 | 170,560 |
| 83 | 🇸🇩 Sudan | 9,900 | 34,550 |
| 84 | 🇨🇲 Cameroon | 9,800 | 290,330 |
| 85 | 🇦🇱 Albania | 8,641 | 9,642 |
| 86 | 🇧🇾 Belarus | 8,504 | 611 |
| 87 | 🇲🇱 Mali | 8,484 | 107,100 |
| 88 | 🇨🇾 Cyprus | 7,862 | 1,401 |
| 89 | 🇷🇸 Serbia | 7,308 | 2,354 |
| 90 | 🇵🇦 Panama | 6,704 | 177,069 |
| 91 | 🇵🇬 Papua New Guinea |
6,122 | 188,664 |
| 92 | 🇨🇮 Cote d’Ivoire | 5,720 | 105,295 |
| 93 | 🇰🇿 Kazakhstan | 5,438 | 41,457 |
| 94 | 🇸🇬 Singapore | 5,244 | 306 |
| 95 | 🇨🇩 DRC | 5,195 | 228,665 |
| 96 | 🇱🇹 Lithuania | 5,138 | 96,152 |
| 97 | 🇿🇼 Zimbabwe | 5,058 | 22,734 |
| 98 | 🇦🇹 Austria | 4,920 | 350 |
| 99 | 🇩🇿 Algeria | 4,779 | 79,200 |
| 100 | 🇧🇳 Brunei Darussalam |
4,768 | 15,295 |
| 101 | 🇧🇯 Benin | 4,150 | 74,615 |
| 102 | 🇭🇰 Hong Kong | 3,909 | 115,179 |
| 103 | 🇧🇴 Bolivia | 3,853 | 7,600 |
| 104 | 🇧🇦 Bosnia & Herzegovina | 3,819 | 305 |
| 105 | 🇦🇷 Argentina | 3,687 | 852,566 |
| 106 | 🇲🇿 Mozambique | 3,200 | 373,563 |
| 107 | 🇲🇰 North Macedonia | 3,169 | 514 |
| 108 | 🇦🇴 Angola | 2,808 | 528,964 |
| 109 | 🇬🇪 Georgia | 2,790 | 217,575 |
| 110 | 🇩🇴 Dominican Republic | 2,730 | 17,667 |
| 111 | 🇦🇪 UAE | 2,663 | 61,189 |
| 112 | 🇨🇭 Switzerland | 2,364 | 1,486 |
| 113 | 🇸🇾 Syria | 2,350 | 4,310 |
| 114 | 🇲🇺 Mauritius | 2,316 | 30,640 |
| 115 | 🇸🇰 Slovak Republic | 2,304 | 1,815 |
| 116 | 🇯🇴 Jordan | 2,145 | 665 |
| 117 | 🇹🇯 Tajikistan | 2,039 | 2,350 |
| 118 | 🇲🇦 Morocco | 2,006 | 1,432,199 |
| 119 | 🇴🇲 Oman | 1,703 | 922,083 |
| 120 | 🇸🇮 Slovenia | 1,686 | 269 |
| 121 | 🇭🇹 Haiti | 1,610 | 16,220 |
| 122 | 🇵🇫 French Polynesia | 1,559 | 13,243 |
| 123 | 🇱🇸 Lesotho | 1,501 | 55 |
| 124 | 🇧🇮 Burundi | 1,490 | 19,550 |
| 125 | 🇳🇨 New Caledonia | 1,411 | 3,305 |
| 126 | 🇸🇳 Senegal | 1,151 | 513,957 |
| 127 | 🇬🇳 Guinea | 1,150 | 325,120 |
| 128 | 🇯🇪 Channel Islands | 1,145 | 2,188 |
| 129 | 🇹🇱 Timor-Leste | 1,091 | 4,933 |
| 130 | 🇨🇬 Congo | 911 | 69,419 |
| 131 | 🇱🇻 Latvia | 901 | 61,658 |
| 132 | 🇯🇲 Jamaica | 884 | 10,956 |
| 133 | 🇹🇬 Togo | 882 | 17,984 |
| 134 | 🇧🇫 Burkina Faso | 878 | 29,731 |
| 135 | 🇲🇪 Montenegro | 858 | 808 |
| 136 | 🇪🇪 Estonia | 849 | 72,236 |
| 137 | 🇱🇧 Lebanon | 778 | 2,580 |
| 138 | 🇪🇹 Ethiopia | 740 | 60,650 |
| 139 | 🇵🇸 West Bank & Gaza |
687 | 4,661 |
| 140 | 🇧🇿 Belize | 605 | 191,621 |
| 141 | 🇦🇿 Azerbaijan | 507 | 1,464 |
| 142 | 🇳🇪 Niger | 472 | 47,200 |
| 143 | 🇰🇼 Kuwait | 450 | 3,525 |
| 144 | 🇳🇦 Namibia | 321 | 410,849 |
| 145 | 🇱🇷 Liberia | 275 | 25,169 |
| 146 | 🇧🇪 Belgium | 223 | 17,937 |
| 147 | 🇨🇫 Central African Republic |
215 | 28,000 |
| 148 | 🇱🇨 St. Lucia | 211 | 1,414 |
| 149 | 🇫🇯 Fiji | 206 | 32,874 |
| 150 | 🇧🇹 Bhutan | 193 | 15 |
| 151 | 🇧🇼 Botswana | 163 | 38 |
| 152 | 🇹🇲 Turkmenistan | 160 | 15,042 |
| 153 | 🇬🇾 Guyana | 142 | 34,216 |
| 154 | 🇸🇱 Sierra Leone | 115 | 204,900 |
| 155 | 🇬🇺 Guam | 115 | 26 |
| 156 | 🇶🇦 Qatar | 114 | 16,555 |
| 157 | 🇹🇩 Chad | 110 | 103,000 |
| 158 | 🇺🇾 Uruguay | 103 | 66,300 |
| 159 | 🇹🇴 Tonga | 100 | 1,165 |
| 160 | 🇸🇿 Eswatini | 100 | 65 |
| 161 | 🇬🇦 Gabon | 65 | 29,860 |
| 162 | 🇸🇸 South Sudan | 45 | 32,500 |
| 163 | 🇲🇵 Northern Mariana Islands |
41 | 189 |
| 164 | 🇸🇷 Suriname | 40 | 32,130 |
| 165 | 🇬🇲 Gambia | 35 | 52,652 |
| 166 | 🇨🇻 Cabo Verde | 28 | 11,624 |
| 167 | 🇧🇧 Barbados | 26 | 847 |
| 168 | 🇬🇩 Grenada | 23 | 1,024 |
| 169 | 🇦🇬 Antigua & Barbuda |
20 | 3,205 |
| 170 | 🇦🇸 American Samoa | 20 | 1,059 |
| 171 | 🇹🇹 Trinidad & Tobago |
18 | 13,084 |
| 172 | 🇵🇼 Palau | 18 | 786 |
| 173 | 🇵🇷 Puerto Rico | 18 | 1,580 |
| 174 | 🇧🇭 Bahrain | 16 | 15,720 |
| 175 | 🇬🇶 Equatorial Guinea | 15 | 6,307 |
| 176 | 🇻🇨 St. Vincent & the Grenadines |
13 | 1,586 |
| 177 | 🇾🇪 Yemen | 10 | 131,307 |
| 178 | 🇬🇼 Guinea-Bissau | 10 | 63,221 |
| 179 | 🇱🇾 Libya | 10 | 31,951 |
| 180 | 🇼🇸 Samoa | 10 | 9,176 |
| 181 | 🇰🇾 Cayman Islands | 10 | 125 |
| 182 | 🇻🇮 Virgin Islands | 8 | 420 |
| 183 | 🇪🇷 Eritrea | 4 | 4,574 |
| 184 | 🇻🇺 Vanuatu | 3 | 55,932 |
| 185 | 🇰🇮 Kiribati | 2 | 191,166 |
| 186 | 🇰🇳 St. Kitts & Nevis |
2 | 369 |
| 187 | 🇦🇼 Aruba | 2 | 165 |
| 188 | 🇹🇻 Tuvalu | 1 | 31,096 |
| 189 | 🇻🇬 British Virgin Islands | 1 | 1,133 |
| 190 | 🇩🇲 Dominica | 1 | 288 |
| 191 | 🇳🇷 Nauru | 1 | 120,409 |
| 192 | 🇲🇭 Marshall Islands | 0 | 95,933 |
| 193 | 🇫🇲 Micronesia | 0 | 166,334 |
| 194 | 🇸🇨 Seychelles | 0 | 139,174 |
| 195 | 🇨🇼 Curacao | 0 | 25,027 |
| 196 | 🇧🇸 Bahamas | 0 | 8,705 |
| 197 | 🇹🇨 Turks & Caicos Islands |
0 | 2,277 |
| 198 | 🇲🇷 Mauritania | 0 | 860,217 |
| 199 | 🇬🇱 Greenland | 0 | 271,027 |
| 200 | 🇲🇻 Maldives | 0 | 144,993 |
| 201 | 🇸🇴 Somalia | 0 | 30,000 |
| 202 | 🇰🇲 Comoros | 0 | 19,356 |
| 203 | 🇸🇹 Sao Tome & Principe |
0 | 6,020 |
| 204 | 🇩🇯 Djibouti | 0 | 3,089 |
| 205 | 🇮🇲 Isle of Man | 0 | 3,041 |
| 206 | 🇲🇴 Macao | 0 | 1,500 |
| 207 | 🇧🇲 Bermuda | 0 | 419 |
| 208 | 🇸🇽 Sint Maarten | 0 | 253 |
| 209 | 🇫🇷 St. Martin | 0 | 90 |
| 210 | 🇬🇮 Gibraltar | 0 | 1 |
| 211 | 🇲🇨 Monaco | 0 | 1 |
| N/A | 🌐 World | 126,035,146 | 92,177,119 |
Source: World Bank.
Aquaculture makes up the majority of fish production for all the big Asian producers in the top 10. However the inverse is true for European, North American, and South American countries.
While the history of aquaculture goes back thousands of years, its use began to rise steeply in the 2000s, with production overtaking captured fish in 2014. First seen as a solution to overfishing and to make the industry more sustainable, aquaculture’s problems are now beginning to weigh on the industry.
From the pollution it causes—in the form of feces—to its dependence on wild catch for feeding the stock, makes it far less sustainable than what is assumed. In fact, about 25% of wild catch is turned into fish meal—a mixture of less appetizing fish like anchovies, menhaden and herring—used to feed farmed fish.
Fish and seafood is one of the most accessible sources of meat in the world, accounting for 17% of animal protein consumed. However, almost 90% of the world’s fish stocks are fully depleted while demand only continues to grow.
Unregulated and illegal fishing not only adds a sustainability burden to the planet, but the industry is also rife with human rights abuses, including human trafficking and modern slavery.
Meanwhile, only 3% of the world’s oceans are designated as protected marine reserves and even they lack the safeguards to fully stop exploitative fishing.
This article was published as a part of Visual Capitalist’s Creator Program, which features data-driven visuals from some of our favorite Creators around the world.
Visualizing Asia’s $40 Trillion Economy
Ranked: The 15 Largest Countries in the World by Land Area
Ranked: How Much People Trust Institutions, by Country
Charted: The GDP Impact of Trump’s Tariffs on China
Visualizing China’s Dependence on U.S. Trade
Charted: Approval Ratings of 24 World Leaders in 2025
Ranking the top 15 by land area instead of total area produces some interesting results. Read why here.
Published
on
By
This was originally posted on our Voronoi app. Download the app for free on iOS or Android and discover incredible data-driven charts from a variety of trusted sources.
This graphic ranks the 15 largest countries in the world, by land area. Data is sourced from the World Bank, last updated January, 2025.
It also includes the share of forest and agricultural land per country. We explain how these metrics are calculated in later sections.
Russia is the largest country by land area (16.4 million km² / 6.2 million sq. miles), nearly double the size of second-ranked China (9.4 million km² / 3.6 million sq. miles ).
| Rank | Country | Land Area (Sq. km) | Land Area (Sq. miles) |
|---|---|---|---|
| 1 | 🇷🇺 Russia | 16.4M sq. km | 6.2M sq. miles |
| 2 | 🇨🇳 China | 9.4M sq. km | 3.6M sq. miles |
| 3 | 🇺🇸 U.S. | 9.2M sq. km | 3.5M sq. miles |
| 4 | 🇨🇦 Canada | 8.8M sq. km | 3.4M sq. miles |
| 5 | 🇧🇷 Brazil | 8.4M sq. km | 3.2M sq. miles |
| 6 | 🇦🇺 Australia | 7.7M sq. km | 3.0M sq. miles |
| 7 | 🇮🇳 India | 3.0M sq. km | 1.2M sq. miles |
| 8 | 🇦🇷 Argentina | 2.7M sq. km | 1.1M sq. miles |
| 9 | 🇰🇿 Kazakhstan | 2.7M sq. km | 1.0M sq. miles |
| 10 | 🇩🇿 Algeria | 2.4M sq. km | 920K sq. miles |
| 11 | 🇨🇩 DRC | 2.3M sq. km | 875K sq. miles |
| 12 | 🇸🇦 Saudi Arabia | 2.1M sq. km | 830K sq. miles |
| 13 | 🇲🇽 Mexico | 1.9M sq. km | 751K sq. miles |
| 14 | 🇮🇩 Indonesia | 1.9M sq. km | 731K sq. miles |
| 15 | 🇸🇩 Sudan | 1.9M sq. km | 721K sq. miles |
Note: Source data converted to square miles.
But hold on, isn’t Canada supposed to be the second-largest country in the world? The answer is: it depends.
As previously mentioned, land area is a very specific term that doesn’t include area under lakes and rivers. As a result, Canada—where 9% of the total area is covered by freshwater—loses some ground to peers.
Per the World Bank, land area is an important estimation of a country’s agricultural ability and is used to track the environmental effects of human activity.
A benefit of measuring land area is seeing how much of a share forests and agricultural land take up.
In Russia, for example, nearly half of its entire area is covered by forests.
| Rank | Country | Forests (Share of Land Area) |
Agricultural Land | Other Land |
|---|---|---|---|---|
| 1 | 🇷🇺 Russia | 50% | 13% | 37% |
| 2 | 🇨🇳 China | 24% | 55% | 21% |
| 3 | 🇺🇸 U.S. | 34% | 45% | 21% |
| 4 | 🇨🇦 Canada | 40% | 7% | 54% |
| 5 | 🇧🇷 Brazil | 59% | 27% | 14% |
| 6 | 🇦🇺 Australia | 17% | 47% | 35% |
| 7 | 🇮🇳 India | 24% | 60% | 16% |
| 8 | 🇦🇷 Argentina | 10% | 43% | 46% |
| 9 | 🇰🇿 Kazakhstan | 1% | 79% | 19% |
| 10 | 🇩🇿 Algeria | 1% | 17% | 82% |
| 11 | 🇨🇩 DRC | 55% | 16% | 30% |
| 12 | 🇸🇦 Saudi Arabia | 1% | 81% | 19% |
| 13 | 🇲🇽 Mexico | 34% | 49% | 17% |
| 14 | 🇮🇩 Indonesia | 48% | 30% | 22% |
| 15 | 🇸🇩 Sudan | 10% | 60% | 30% |
Note: Other land is mixed-used terrain and includes residential areas. Sources: 1. Forests as a share of land area. 2. Agricultural land as a share of land area.
In China and the U.S. most of the land available is used for agriculture.
Speaking of agricultural land: Saudi Arabia has it listed at 81% of the land area. This is odd, since most of the country is a desert, with little precipitation, and not exactly suitable for farming.
A quick check of the metadata reveals that agricultural land is a self-reported figure and includes croplands, pastures, and land devoted to the rearing of animals.
In short, the country may have zoned or declared land as agricultural, even if it’s not used as such.
Over the last century, more and more of the human population has moved to cities.
As a result they’ve become hubs of economic growth, in turn attracting more people, and many of them are more populous than entire countries.
But cities don’t take up much room, especially compared to forests.
| Rank | Country | Urban Land (% of Land Area) |
Urban Land (Sq. km) |
|---|---|---|---|
| 1 | 🇷🇺 Russia | 0.32% | 52,887 |
| 2 | 🇨🇳 China | 5.56% | 522,345 |
| 3 | 🇺🇸 U.S. | 2.04% | 186,573 |
| 4 | 🇨🇦 Canada | 0.16% | 13,983 |
| 5 | 🇧🇷 Brazil | 0.55% | 45,853 |
| 6 | 🇦🇺 Australia | 0.16% | 11,946 |
| 7 | 🇮🇳 India | 5.78% | 171,839 |
| 8 | 🇦🇷 Argentina | 0.42% | 11,433 |
| 9 | 🇰🇿 Kazakhstan | 0.24% | 6,363 |
| 10 | 🇩🇿 Algeria | 0.39% | 9,357 |
| 11 | 🇨🇩 DRC | 0.32% | 7,232 |
| 12 | 🇸🇦 Saudi Arabia | 0.36% | 7,757 |
| 13 | 🇲🇽 Mexico | 1.47% | 28,588 |
| 14 | 🇮🇩 Indonesia | 3.58% | 67,755 |
| 15 | 🇸🇩 Sudan | 0.20% | 3,790 |
Source: Urban land area.
In the top 15 ranks, China has the largest share of urban land (5%), as well as the most area built into cities.
Australia has the least share (0.16%) but Sudan has the smallest total city area (3,790 km2), as its people live mostly in the rural countryside.
Wondering what the largest cities in the world are? Check out: Ranked: All the Cities Larger Than NYC for another comparison chart.
Mapped: The Top Import Partner of Every U.S. State
Visualizing the Global Population in 2035, by Generation
Charted: The Countries that Speak the Most Languages
The 10 Most Powerful Air Forces in the World
Visualizing How Americans Spend Their Money
Ranked: The World’s 50 Most Profitable Companies in 2024
Visualizing the World’s Super-Aged Societies
Mapped: All of the World’s Countries, by Income Group
Copyright © 2025 Visual Capitalist | Privacy Policy
Do Not Sell My Information